Aug 16, 2022
Algorithm learns to correct 3D printing errors for different parts, materials and systems
Posted by Shubham Ghosh Roy in categories: 3D printing, biotech/medical, information science, robotics/AI
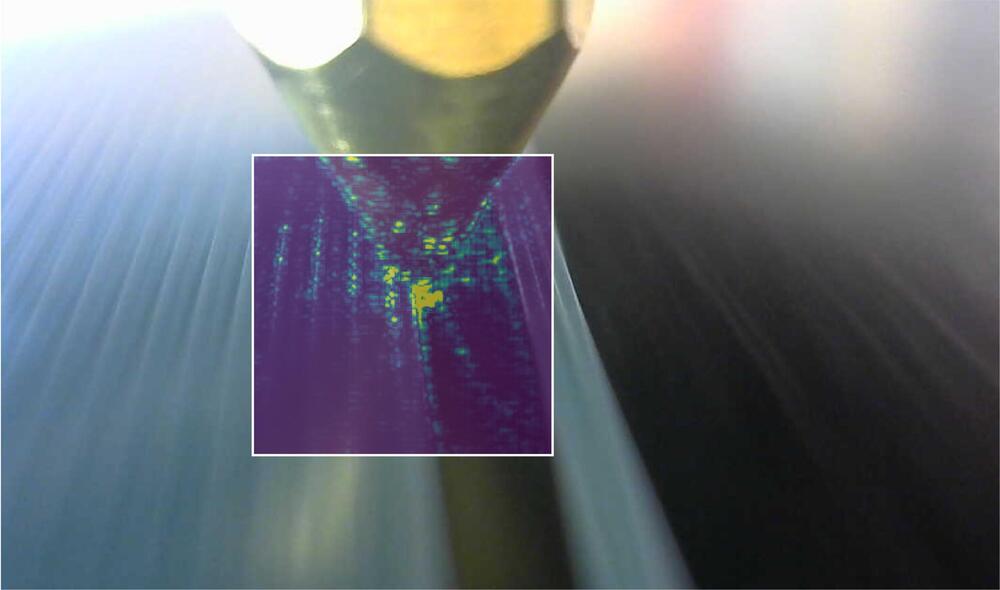
Engineers have created intelligent 3D printers that can quickly detect and correct errors, even in previously unseen designs, or unfamiliar materials like ketchup and mayonnaise, by learning from the experiences of other machines.
The engineers, from the University of Cambridge, developed a machine learning algorithm that can detect and correct a wide variety of different errors in real time, and can be easily added to new or existing machines to enhance their capabilities. 3D printers using the algorithm could also learn how to print new materials by themselves. Details of their low-cost approach are reported in the journal Nature Communications.
3D printing has the potential to revolutionize the production of complex and customized parts, such as aircraft components, personalized medical implants, or even intricate sweets, and could also transform manufacturing supply chains. However, it is also vulnerable to production errors, from small-scale inaccuracies and mechanical weaknesses through to total build failures.


